



Only 22% of CMOs say they can confidently defend influencer spend in front of a board, according to recent eMarketer survey data. The rest are stuck translating engagement rates into language that means nothing to a CFO. If your board-level reporting template for creator marketing still leads with impressions, you’re setting up your next budget conversation to fail.
Boards don’t care about vanity metrics. They care about capital efficiency, risk exposure, and whether a channel scales. This piece breaks down what actually belongs in a board deck, how to structure it, and which numbers earn you more budget instead of a skeptical follow-up email.
Why Most Creator Reports Never Make It Past the Marketing Team
Here’s the uncomfortable truth: most influencer reporting is built for marketers, not executives. It’s optimized for showing effort, not outcomes. Reach charts, follower growth, a highlight reel of top posts. All fine for a Monday team standup. All useless in a boardroom where the next agenda item is capital allocation for the next fiscal year.
Board members think in three categories: revenue impact, risk exposure, and comparative return against other channels. If your report doesn’t map cleanly to those three buckets, it gets skimmed and forgotten. Worse, it invites the question every marketing leader dreads: “so what did we actually get for this?”
A board slide that leads with engagement rate instead of revenue per dollar spent is a slide that gets your budget cut, not renewed.
The Four Sections Every Board Template Needs
Strip away the noise and a defensible board report for creator marketing comes down to four sections. Nothing more. Executives skim, so density matters more than completeness.
- Financial performance: revenue attributed, cost per acquisition, blended ROAS, and trend versus prior period.
- Risk posture: compliance status, contract exposure, and any open governance flags.
- Portfolio efficiency: spend by tier, channel, and format, benchmarked against the tier allocation model you’re running.
- Forward outlook: what’s scaling, what’s getting cut, and what needs incremental investment next quarter.
That’s it. Four sections, one page each if you can manage it. If you’re building spend allocation logic to feed this template, the creator tier allocation model gives you a repeatable framework for the portfolio section specifically.
Financial Performance: Lead With Revenue, Not Reach
Every board template should open with a single number: revenue generated relative to spend. Not impressions. Not engagement. Revenue.
That means your reporting infrastructure has to tie creator activity to actual conversion data, not just platform-reported engagement. If your organization is still stitching this together manually, you have a measurement gap before you have a reporting gap. Deterministic tracking has become the baseline expectation for anyone reporting influencer results to finance, which is why more programs are shifting toward deterministic identity resolution instead of relying on platform attribution alone.
Once you have clean revenue data, layer in comparative context. Boards want to know how creator spend performs against paid social, search, or affiliate. A single ROAS number in isolation means little. A ROAS number next to your other channels’ ROAS is a story. If you’re running promo codes or affiliate links as your primary attribution mechanism, benchmark against the promo code lift targets you set at signing, and flag any creator whose actual lift fell short.
Include cost per managed dollar if your program runs through an agency or hybrid model. Boards increasingly ask about operational overhead, not just media spend, especially when comparing an in-house team against an agency of record arrangement. That number tells them whether your operational structure itself is efficient.
Risk Posture: The Section Legal Actually Reads
This is the section that gets skipped most often and causes the most damage when it’s missing. Boards have grown allergic to surprises, especially the kind that show up as an FTC disclosure violation or a data privacy complaint filed with a regulator like the ICO.
Your risk section should answer three questions in plain language: What’s our current compliance exposure? What contracts create liability if a creator behaves badly? What governance controls are actually in place versus theoretical?
If you’ve stood up a formal oversight structure, this is where you reference it. Programs with active creator governance committees tend to have cleaner answers here because the vetting and escalation process is already documented rather than improvised after an incident.
Contract risk deserves its own line item too. Multi-year deals, revenue-based pay structures, and nano-creator agreements all carry different exposure profiles. A board that’s approved multi year creator contracts to lock in rates wants to see that those commitments are tracked against actual performance, not just booked as a fixed cost.
A risk section with zero flags isn’t reassuring, it’s suspicious. Boards trust reports that show active monitoring, not reports that claim nothing ever goes wrong.
Portfolio Efficiency: Show the Math, Not Just the Outcome
Boards respond well to visible logic. Rather than presenting a final ROAS number and asking them to trust it, show the allocation model behind it. Spend by creator tier, spend by content format, and spend by platform, each with its own return line.
This is also where regional programs need to show their work. If you’re running different rate structures across markets, reference how those regional budget allocation decisions were made and what return each market is generating. A board overseeing a global brand wants confirmation that spend isn’t just uniform across regions with wildly different cost structures and conversion rates.
Format mix matters here too. If you’re splitting budget across short-form UGC, long-form YouTube, and livestream, don’t bury that detail. Reference your hybrid asset budgeting approach directly so the board understands why cost per asset varies so much between formats. Otherwise you’ll get asked why one line item costs five times another with no context.
Consider adding a simple table structure for this section:
- Tier (nano, micro, mid, macro) with spend share and ROAS
- Format (short video, long-form, livestream, static) with cost per asset and conversion rate
- Platform with spend share and platform-specific ROAS
Three rows of data, cleanly presented, does more to build board confidence than ten pages of narrative.
Forward Outlook: This Is Where You Ask for More Budget
The last section is where marketing leaders either win their next quarter’s budget or spend it defending the last one. Frame this section around three moves: scale, hold, cut.
What’s scaling should be tied to a specific hypothesis, not just “it’s working, let’s do more.” If you ran a hold out experiment to isolate true incremental lift, this is where that data earns its keep. Boards trust incrementality testing far more than correlation-based claims, because it directly answers the question every board eventually asks: would this revenue have happened anyway?
What’s holding steady should be framed as a stable, de-risked allocation, not a placeholder. And what’s getting cut needs a clear rationale tied to the reallocation logic you’re using elsewhere in the org. If you’re shifting spend from reach-focused activity toward revenue-generating tactics, reference the budget reallocation playbook guiding that decision so it reads as strategy, not reaction.
If your program has an experimental platform budget carved out for testing new channels like emerging short-form apps, keep that separate from your core reporting. Boards generally accept a small, clearly labeled reserve for experimentation, especially when it’s structured using a defined framework like experimental platform reserves rather than an open-ended line item that looks like scope creep.
Formatting Rules That Actually Matter
A few operational notes that separate a report that lands from one that doesn’t:
- Keep the deck under 12 slides. Boards allocate 10 to 15 minutes per topic, not an hour.
- Lead every slide with the number, not the chart. Executives read left to right, top to bottom.
- Use consistent time periods. Quarter over quarter, not a mix of monthly and annual comparisons that force the board to do math mid-meeting.
- Include a one-line “so what” under every chart. Data without interpretation invites the board to interpret it for you, and that rarely goes your way.
It also helps to standardize this reporting cadence across teams so numbers don’t shift depending on who built the deck. If your organization runs creator programs across multiple business units, cross-functional consistency matters more than any single slide design. Structural alignment between finance, legal, and marketing usually comes down to cross team governance practices that standardize definitions before the reporting even gets built.
What Happens When the Reporting Infrastructure Is Missing
Companies that treat creator reporting as a campaign-by-campaign exercise tend to hit a wall the moment a board asks for trend data across multiple quarters. There’s no consistent baseline, no shared definition of ROAS, no historical archive to pull from. That’s a symptom of treating creator marketing as a series of campaigns instead of durable infrastructure, a distinction covered well in campaign thinking vs infrastructure.
The fix isn’t complicated, but it does require discipline. Standardize your metrics definitions once, document them, and refuse to let individual campaign teams redefine ROAS or attribution windows to make their own numbers look better. Boards notice inconsistency faster than they notice mediocre performance.
FAQs
Frequently Asked Questions
What metrics should a board-level creator marketing report include?
Prioritize revenue attributed, blended ROAS, cost per acquisition, spend by tier and format, and any active compliance or contract risk flags. Engagement and reach metrics can support the narrative but should never lead the report.
How often should creator marketing reporting go to the board?
Quarterly is standard for most organizations, aligned with broader marketing budget reviews. Monthly reporting is more appropriate for internal team management, not board-level presentations.
How do you calculate ROAS for influencer campaigns when attribution is messy?
Use deterministic tracking wherever possible, such as unique promo codes, dedicated landing pages, or platform-verified purchase data, rather than relying solely on self-reported engagement from creators or platforms.
Should risk and compliance data be part of the same deck as performance metrics?
Yes. Separating them signals that risk is an afterthought. Boards respond better to an integrated report where financial performance and risk exposure are reviewed together each cycle.
What’s the biggest mistake marketers make in board reporting for creator programs?
Leading with vanity metrics like follower growth or impressions instead of revenue impact. It signals that the marketing team hasn’t connected creator activity to business outcomes, which invites budget scrutiny rather than confidence.
Build your next board deck around four sections only: financial performance, risk posture, portfolio efficiency, and forward outlook. Get those right and the budget conversation stops being a defense and starts being a negotiation.
Top Influencer Marketing Agencies
The leading agencies shaping influencer marketing in 2026
Agencies ranked by campaign performance, client diversity, platform expertise, proven ROI, industry recognition, and client satisfaction. Assessed through verified case studies, reviews, and industry consultations.
Moburst

-
2

The Shelf
Boutique Beauty & Lifestyle Influencer AgencyA data-driven boutique agency specializing exclusively in beauty, wellness, and lifestyle influencer campaigns on Instagram and TikTok. Best for brands already focused on the beauty/personal care space that need curated, aesthetic-driven content.Clients: Pepsi, The Honest Company, Hims, Elf Cosmetics, Pure LeafVisit The Shelf → -
3
Audiencly
Niche Gaming & Esports Influencer AgencyA specialized agency focused exclusively on gaming and esports creators on YouTube, Twitch, and TikTok. Ideal if your campaign is 100% gaming-focused — from game launches to hardware and esports events.Clients: Epic Games, NordVPN, Ubisoft, Wargaming, Tencent GamesVisit Audiencly → -
4

Viral Nation
Global Influencer Marketing & Talent AgencyA dual talent management and marketing agency with proprietary brand safety tools and a global creator network spanning nano-influencers to celebrities across all major platforms.Clients: Meta, Activision Blizzard, Energizer, Aston Martin, WalmartVisit Viral Nation → -
5
The Influencer Marketing Factory
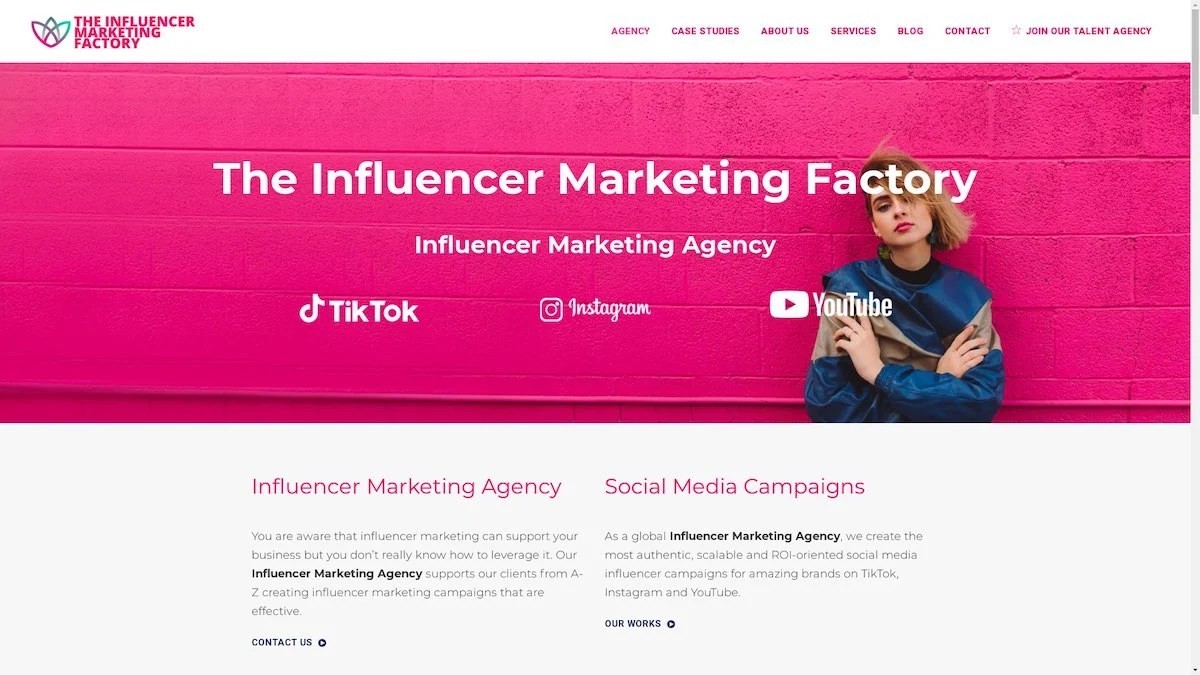
TikTok, Instagram & YouTube CampaignsA full-service agency with strong TikTok expertise, offering end-to-end campaign management from influencer discovery through performance reporting with a focus on platform-native content.Clients: Google, Snapchat, Universal Music, Bumble, YelpVisit TIMF → -
6

NeoReach
Enterprise Analytics & Influencer CampaignsAn enterprise-focused agency combining managed campaigns with a powerful self-service data platform for influencer search, audience analytics, and attribution modeling.Clients: Amazon, Airbnb, Netflix, Honda, The New York TimesVisit NeoReach → -
7
Ubiquitous
Creator-First Marketing PlatformA tech-driven platform combining self-service tools with managed campaign options, emphasizing speed and scalability for brands managing multiple influencer relationships.Clients: Lyft, Disney, Target, American Eagle, NetflixVisit Ubiquitous → -
8
Obviously
Scalable Enterprise Influencer CampaignsA tech-enabled agency built for high-volume campaigns, coordinating hundreds of creators simultaneously with end-to-end logistics, content rights management, and product seeding.Clients: Google, Ulta Beauty, Converse, AmazonVisit Obviously →