



Eighty-four percent of global marketers say they are very or extremely confident in their ROI measurement. Yet according to Nielsen, only 38% say they evaluate the holistic ROI of their marketing by measuring traditional and digital together. That gap is where budgets go to die. A unified ROI scorecard closes it by putting creator, event and linear media spend on one comparable scale.
Why three channels never reconcile on their own
Each channel reports in its own dialect. Creator programs speak in engagement, views and promo-code redemptions. Event teams speak in leads, meetings booked and pipeline touched. Linear TV buyers speak in GRPs, reach and frequency.
Put those three reports side by side and a CFO sees three languages and zero answers.
The spend is real, though. In Gartner’s 2024 CMO Spend Survey, event marketing (17.1%), sponsorship (16.4%) and TV (16%) were the top offline channels for investment. Creators sit on top of that, often funded from a separate social or brand line. Three budgets, three owners, three measurement habits.
The measurement problem is also a confidence problem. Nielsen’s 2024 Annual Marketing Report found that 84% of surveyed marketers feel confident in their ROI measurement, while just 38% measure the holistic return of traditional and digital together. Confidence is high. Comparability is low.
If you cannot compare a creator dollar, an event dollar and a TV dollar on the same page, you are not allocating budget. You are negotiating with whoever shouts loudest.
What a unified ROI scorecard actually is
It is not a dashboard. It is a one-page decision tool that scores every line of spend against the same five questions, using the same definitions, reviewed on the same calendar.
Think of it as the bridge between channel reports and a budget decision. Channel teams keep their native metrics. The scorecard translates them.
The principle matches what the IAB advocates in its cross-channel measurement playbook. As Search Engine Journal reports, the playbook stresses defining SMART goals and KPIs as the foundation for aligned measurement, and it says integrating data from various sources gives a holistic view of consumer behavior. A scorecard is simply that principle made operational.
The five columns every line item must fill
Resist the urge to add a sixth. Every extra column is another place for teams to hide.
- Fully loaded cost. Fees, production, talent, media, travel, staffing, usage rights, agency commission and measurement costs. Event teams routinely forget staff time. Creator teams forget rights extensions.
- Incremental outcome. The result you can credibly attribute to the spend, not the result that merely occurred nearby. Sales, qualified pipeline or new-to-brand customers, depending on the objective.
- Confidence grade. A, B or C based on the measurement method behind the number (more on this below).
- Time to payback. Days, quarters or years. A TV flight and a quarterly event do not pay back on the same clock.
- Reusable asset value. What the spend leaves behind: licensed creator content, event footage, a TV spot you can cut into social.
The fifth column is the one most scorecards miss, and it often flips rankings. A creator partnership that yields 40 usable assets with paid-usage rights is a different animal from a one-off post. If you need a method for valuing that, the cost per asset model is a solid starting point, and the buyout versus license math tells you what those assets really cost over time.
Normalizing the numbers without lying to yourself
Here is where scorecards usually collapse. Someone decides everything must become ROAS, and a brand-building TV flight scores badly by design.
Don’t do that. Normalize on three axes instead.
Axis one: objective, not channel
Group spend by the job it was hired to do: awareness, consideration, conversion or retention. Then compare within each job. A sponsorship that exists to build category presence should be judged against other reach plays, not against a retargeting campaign.
Axis two: measurement confidence
Not all numbers deserve equal trust. Grade them.
- Grade A: incrementality tests, geo holdouts or well-specified marketing mix modeling.
- Grade B: multi-touch or platform-reported attribution with some validation, such as unique codes tied to CRM records.
- Grade C: self-reported surveys, impressions-based estimates or sponsor-supplied recaps.
Then apply a haircut. A common internal rule is to discount Grade C outcomes by a fixed percentage agreed with finance in advance. The exact figure matters less than the fact that everyone agreed to it before results came in. For choosing the right method by spend tier, the guide on MMM versus multi-touch attribution helps.
Axis three: time horizon
Convert everything to a common window, say twelve months, and show payback speed beside it. Linear TV rarely wins on 30-day payback. It may win on twelve-month blended efficiency. The scorecard should let both facts coexist.
A scorecard that punishes brand-building channels for being slow, or rewards performance channels for harvesting demand they did not create, is worse than no scorecard.
How each channel feeds the scorecard
Creator spend
Strip out vanity metrics before anything enters the card. Views and likes are inputs to diagnosis, not outcomes. Track code redemptions, branded search lift, assisted conversions and asset reuse. If your team is still reporting reach as a result, the four-phase retirement plan for vanity metrics gives you a path out. Creators also carry platform risk, so note concentration on the card (see budget caps for platform risk).
Event spend
Events have the messiest cost side. Count booth, travel, staffing, content capture and the opportunity cost of pulling sales out of the field. On the outcome side, separate sourced pipeline from influenced pipeline and never blend them. Sponsorship teams can borrow structure from the four-bucket event budget approach so every dollar has a category before it reaches the card.
Linear media
TV and other linear buys usually arrive with the best-audited delivery data and the weakest link to sales. Pair delivery data with a modeled sales contribution, ideally from MMM, and mark the confidence grade honestly. Do not let a clean GRP report masquerade as a Grade A outcome.
A worked example, with made-up numbers
Imagine a consumer brand with a mid-size budget split across a creator program, two trade events and a regional TV flight. All figures below are illustrative, not benchmarks.
- The creator program costs the most to manage but yields reusable assets and a Grade B outcome through unique codes. Payback is fast. Asset value is high.
- The events deliver sourced pipeline at Grade B but influenced pipeline at Grade C. After the haircut, one event holds up and the other does not.
- The TV flight shows modest 30-day payback but a strong twelve-month contribution in the MMM, graded A.
Read separately, the creator report looks like the winner, the event looks decent and TV looks wasteful. On the scorecard, the weaker event is the clear cut, TV is protected, and part of the savings funds more creator volume. Nobody had to argue about whose metric was better.
Governance: who owns the card?
A scorecard owned by one channel team will be distrusted by the other two. Finance should own the definitions. Marketing should own the inputs. Legal should sign off where creator rights or disclosures change cost or risk.
A small cross-functional group works best, similar to the structure outlined in creator governance boards. Set a quarterly review, freeze definitions between reviews and log every change.
Before you launch, check readiness. Do you have clean tagging, agreed cost categories and a measurement partner who can support Grade A testing? The five-layer readiness checklist is a quick way to find the holes.
Common failure modes
- Cherry-picked windows. Teams choose the attribution window that flatters their channel. Lock windows by objective.
- Double counting. A customer who saw a creator post, attended an event and watched TV gets credited three times. Reconcile against total revenue.
- Cost omissions. Internal labor and rights fees vanish from the denominator.
- Scorecard as verdict. The card informs decisions. It does not replace judgment on strategic bets.
Start with the spend you already have. Pick one objective, fill the five columns for one creator program, one event and one linear buy, and bring the result to your next finance review as a draft to be challenged.
FAQs
What is a unified ROI scorecard?
It is a single-page framework that scores every marketing line item on the same criteria: fully loaded cost, incremental outcome, confidence grade, payback time and reusable asset value. It lets you compare creator, event and linear media spend without forcing them into one metric.
Can you compare brand-building TV with performance creator campaigns fairly?
Yes, if you compare within objective and over a common time horizon. Group spend by the job it performs, show both short-term payback and twelve-month contribution, and grade the measurement confidence behind each number.
How do you handle events with long sales cycles?
Separate sourced pipeline from influenced pipeline, track both over the full cycle, and apply a confidence haircut to influenced figures. Review closed-won revenue retroactively and update the card each quarter.
Which measurement method is best for the scorecard?
Incrementality tests and marketing mix modeling earn the highest confidence grades. Multi-touch and platform attribution can fill gaps at a lower grade. The right mix depends on spend size and how many channels run at once.
Who should own the scorecard?
Finance should own definitions and the discount rules, marketing should supply inputs, and legal should review rights and compliance costs. Single-channel ownership invites bias.
How often should the scorecard be updated?
Quarterly is a good default. Update inputs each quarter, but freeze definitions between reviews so trends remain comparable.
Top Influencer Marketing Agencies
The leading agencies shaping influencer marketing in 2026
Agencies ranked by campaign performance, client diversity, platform expertise, proven ROI, industry recognition, and client satisfaction. Assessed through verified case studies, reviews, and industry consultations.
Moburst
-
2

The Shelf
Boutique Beauty & Lifestyle Influencer AgencyA data-driven boutique agency specializing exclusively in beauty, wellness, and lifestyle influencer campaigns on Instagram and TikTok. Best for brands already focused on the beauty/personal care space that need curated, aesthetic-driven content.Clients: Pepsi, The Honest Company, Hims, Elf Cosmetics, Pure LeafVisit The Shelf → -
3
Audiencly
Niche Gaming & Esports Influencer AgencyA specialized agency focused exclusively on gaming and esports creators on YouTube, Twitch, and TikTok. Ideal if your campaign is 100% gaming-focused — from game launches to hardware and esports events.Clients: Epic Games, NordVPN, Ubisoft, Wargaming, Tencent GamesVisit Audiencly → -
4
Viral Nation
Global Influencer Marketing & Talent AgencyA dual talent management and marketing agency with proprietary brand safety tools and a global creator network spanning nano-influencers to celebrities across all major platforms.Clients: Meta, Activision Blizzard, Energizer, Aston Martin, WalmartVisit Viral Nation → -
5
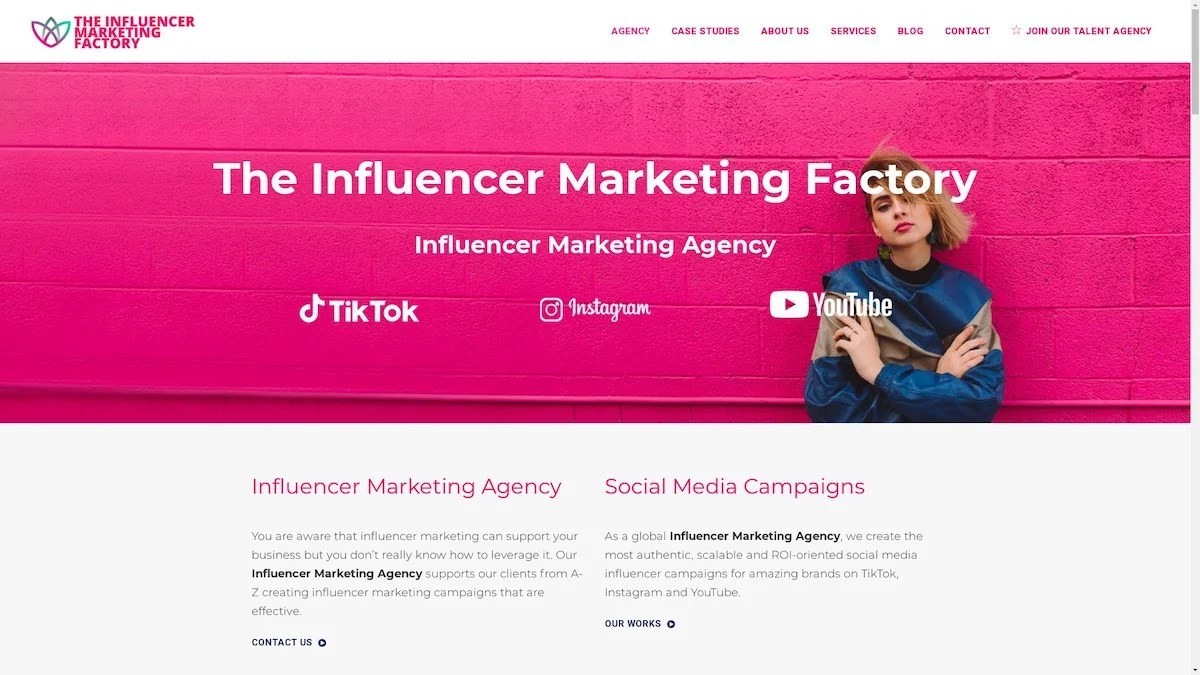
The Influencer Marketing Factory
TikTok, Instagram & YouTube CampaignsA full-service agency with strong TikTok expertise, offering end-to-end campaign management from influencer discovery through performance reporting with a focus on platform-native content.Clients: Google, Snapchat, Universal Music, Bumble, YelpVisit TIMF → -
6

NeoReach
Enterprise Analytics & Influencer CampaignsAn enterprise-focused agency combining managed campaigns with a powerful self-service data platform for influencer search, audience analytics, and attribution modeling.Clients: Amazon, Airbnb, Netflix, Honda, The New York TimesVisit NeoReach → -
7
Ubiquitous
Creator-First Marketing PlatformA tech-driven platform combining self-service tools with managed campaign options, emphasizing speed and scalability for brands managing multiple influencer relationships.Clients: Lyft, Disney, Target, American Eagle, NetflixVisit Ubiquitous → -
8

Obviously
Scalable Enterprise Influencer CampaignsA tech-enabled agency built for high-volume campaigns, coordinating hundreds of creators simultaneously with end-to-end logistics, content rights management, and product seeding.Clients: Google, Ulta Beauty, Converse, AmazonVisit Obviously →