



Your agency quoted a flat rate per video. You bought 40. Only 22 passed legal, matched the brief and looked good enough to run. So what did each video actually cost? That gap is why a cost per usable video benchmark belongs in every UGC budget. Rate cards measure what you pay for. This metric measures what you can use.
Why cost per delivered video misleads you
Delivered is not the same as deployable. A video can arrive on time and still fail: weak audio, the product barely visible, a missing disclosure, a competitor logo in the background, a claim your legal team will never clear.
Most UGC budgets are built on a unit price times a volume. That math assumes every unit ships. It never does.
The stakes are rising because the money is. The IAB’s creator ad spend report projects U.S. creator ad spend at $37 billion in 2025, and it expects it to reach $44 billion in 2026. The same IAB report found that 48% of creator ad buyers now consider creators a “must buy.” When a line item becomes a must buy, finance starts asking harder questions about unit economics.
A rate card tells you the price of a video. Cost per usable video tells you the price of a video you can actually put media behind.
The formula, and what counts as “usable”
The calculation is simple:
Cost per usable video = total program cost for a batch, divided by the number of videos that clear your usability gate.
The hard part is defining the gate before the first brief goes out. If you define it after delivery, you will grade on a curve and the benchmark becomes useless.
A workable usability gate has four checks:
- Brief compliance: required messages, product visibility and hook structure are present.
- Technical quality: resolution, audio clarity, aspect ratio and framing meet your paid-social specs.
- Regulatory pass: claims are substantiated and sponsorship disclosure is in place.
- Rights cleared: licensing terms, music and likeness permissions cover the channels you plan to run.
The disclosure check is not optional. The FTC says that if law enforcement becomes necessary, its focus usually falls on advertisers or their ad agencies, though action against an individual endorser can be appropriate in some circumstances. Translation: a creator’s missed disclosure is your problem. A video that fails that check is not usable, however good it looks.
What goes in the numerator?
This is where most teams undercount. Fees are only the beginning.
- Creator fees, including any bonuses and revision payments
- Product, shipping and sampling costs
- Platform, marketplace or agency management fees
- Internal and freelance review, editing and captioning time
- Usage rights and licensing fees
- Rework and reshoots on rejected content
Licensing deserves its own line. If you plan to put paid media behind a video, the rights cost belongs in the numerator, not in a separate budget that nobody reconciles. Our guide to licensing fee line items shows how to structure that so finance signs off.
A worked example (illustrative numbers)
These figures are hypothetical, built to show the mechanics. Substitute your own.
Say you commission 40 videos from a mix of creators at a blended average fee. Creator fees form the base of the spend. Add product and shipping, platform fees, internal review and editing time, and licensing. Sum every line and you have your total program cost.
Divide that total by all 40 delivered videos and the headline cost per delivered video looks respectable. Not bad. But only 22 clear the gate.
Divide the same total by the 22 that clear the gate and your cost per usable video lands well above the delivered figure. The difference between the two numbers is the price of the 18 videos you paid for and could not run.
Now stretch one level further. If 5 of those 22 videos become paid-social winners worth scaling, divide the total by 5 and you have your cost per winning video. Each step of the funnel tells you something different about where money leaks.
How to set your first benchmark
Don’t borrow a benchmark from a blog post. Prices and pass rates vary wildly by category, platform, creator tier and brief complexity. Build your own.
- Run a pilot of 25 to 40 videos. Enough to see patterns, small enough to cap downside.
- Write the gate first. Score every video pass or fail against the four checks. Log the reason for each failure.
- Segment by source. Track pass rate by creator tier, by sourcing channel (marketplace, agency, in-house roster) and by brief type.
- Calculate three numbers: cost per delivered video, cost per usable video and usable yield (the share that passes).
- Set the benchmark as a range. Use the median result as your target and your worst quartile as the ceiling.
Revisit it every quarter. Platform specs shift, and so do creator expectations.
Where the usable rate usually breaks
Failures cluster. Once you log reasons, you will probably see the same two or three culprits repeat.
Vague briefs. Creators guess, and guesses miss. Over-scripted briefs fail differently: stiff videos that look like ads and perform like ads. The sweet spot is covered in our piece on guardrails, not scripts.
Rights mismatch. A creator agrees to organic posting. You want to run it as a paid ad. Now the video is unusable until you renegotiate. Pricing term, channel and exclusivity up front, as explained in our look at usage rights pricing, prevents that.
Weak sourcing. Cheap sources often have low yield. A cheap creator with a low pass rate can cost more per usable video than the sticker price suggests, because the full cost is spread over only the few videos that pass. A pricier creator with a high pass rate can come out cheaper per usable video. The “expensive” creator is cheaper.
The cheapest rate card often produces the most expensive usable video. Always compare sources on yield, not sticker price.
Turning the benchmark into budget rules
A benchmark that lives in a slide deck changes nothing. Wire it into budget mechanics.
Budget on usable units, not ordered units
If you need 30 usable videos a quarter, divide that need by your benchmark yield to see how many you must order. Build that overage into the plan, rather than discovering the shortfall in week six.
Set kill and scale triggers
Decide in advance what happens when a source falls short. For example: if a sourcing channel’s usable yield drops below an agreed floor for two consecutive batches, pause new orders and review the brief and the vendor. If cost per usable video stays under benchmark and winners emerge, release more budget. Our framework for budget tiers and kill rules fits neatly here.
Tie it to a performance metric
Usable does not mean effective. Pair the metric with downstream results: cost per winning video, and ultimately cost per acquisition from creative that ran. Agentio’s analysis, reported by Forbes, covered $130 million across 65,000 ads and found creators beat brand-only ads on conversion and cost per customer. That is encouraging for creator-led creative, but it is an aggregate. Your own winner rate is what determines whether the economics hold for your brand. For measurement discipline beyond the creative layer, see our attribution and incrementality framework.
Common questions before you roll this out
Will creators resist a pass/fail gate? Not if it is shared upfront. Give creators the checklist with the brief and offer one revision round. Clear criteria reduce rework for everyone.
Who scores the videos? One named owner, ideally someone who is not paid on volume. Scoring by the same person who sourced the creator invites bias.
Does AI review help? It can pre-screen audio, resolution and format. Keep a human on claims and disclosure.
Start this week: pull your last batch of UGC, score each video against a four-check gate, and divide total spend by the passes. That number is your first honest benchmark.
FAQs
What is cost per usable video?
It is the total cost of a UGC batch (creator fees, product, platform fees, review time, licensing and rework) divided by the number of videos that pass your quality, compliance and rights checks. It shows what you really pay for content you can run.
How is it different from cost per video?
Cost per video divides spend by everything delivered. Cost per usable video divides by only what passes your gate. The second figure is always equal to or higher than the first, and the gap measures waste.
What is a good usable yield?
There is no universal figure. Yield depends on category, brief clarity, creator tier and sourcing channel. Run a pilot of 25 to 40 videos, then use your median as the target and your worst quartile as the ceiling.
Should licensing fees be included?
Yes, if you plan to run the video as a paid ad. Content without cleared rights for your intended channels is not usable, so the rights cost belongs in the total.
How does disclosure compliance affect usability?
A video missing a required sponsorship disclosure should fail the gate. The FTC has stated that enforcement attention usually lands on advertisers and their agencies, so the brand carries the risk.
How often should the benchmark be updated?
Quarterly is a sensible default. Revisit sooner if you change platforms, brief formats, sourcing channels or licensing terms.
Is cost per usable video enough on its own?
No. It measures production efficiency. Pair it with cost per winning video and cost per acquisition so you know whether usable content also performs.
Top Influencer Marketing Agencies
The leading agencies shaping influencer marketing in 2026
Agencies ranked by campaign performance, client diversity, platform expertise, proven ROI, industry recognition, and client satisfaction. Assessed through verified case studies, reviews, and industry consultations.
Moburst

-
2

The Shelf
Boutique Beauty & Lifestyle Influencer AgencyA data-driven boutique agency specializing exclusively in beauty, wellness, and lifestyle influencer campaigns on Instagram and TikTok. Best for brands already focused on the beauty/personal care space that need curated, aesthetic-driven content.Clients: Pepsi, The Honest Company, Hims, Elf Cosmetics, Pure LeafVisit The Shelf → -
3
Audiencly
Niche Gaming & Esports Influencer AgencyA specialized agency focused exclusively on gaming and esports creators on YouTube, Twitch, and TikTok. Ideal if your campaign is 100% gaming-focused — from game launches to hardware and esports events.Clients: Epic Games, NordVPN, Ubisoft, Wargaming, Tencent GamesVisit Audiencly → -
4
Viral Nation
Global Influencer Marketing & Talent AgencyA dual talent management and marketing agency with proprietary brand safety tools and a global creator network spanning nano-influencers to celebrities across all major platforms.Clients: Meta, Activision Blizzard, Energizer, Aston Martin, WalmartVisit Viral Nation → -
5
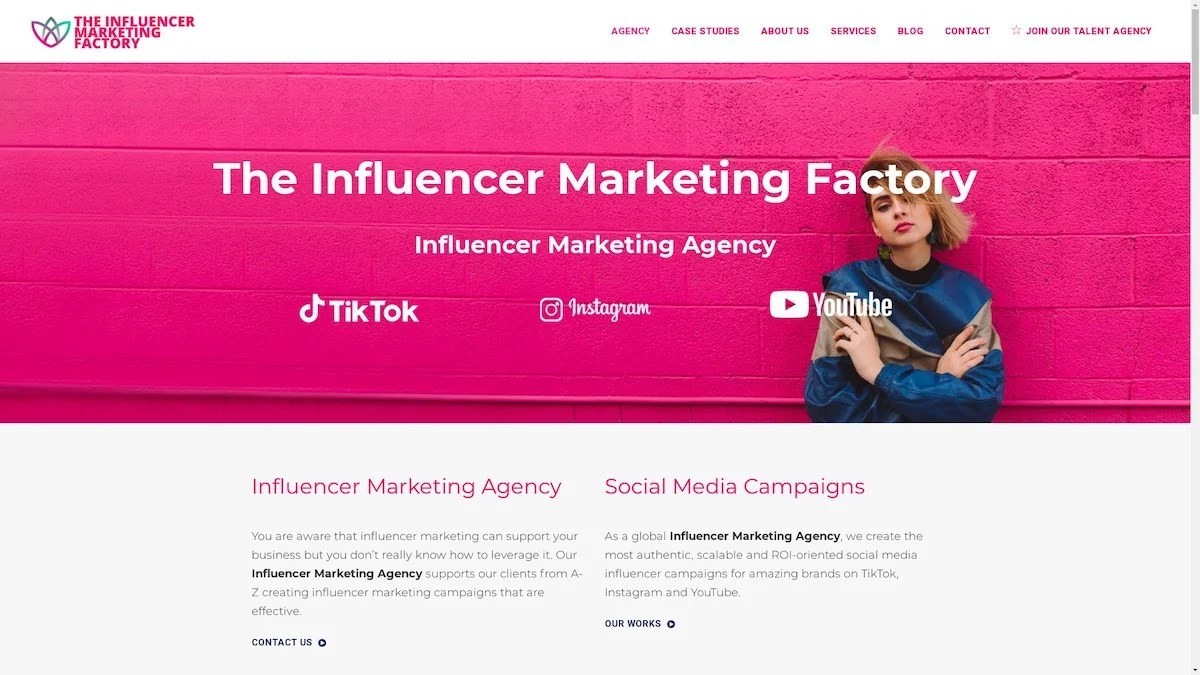
The Influencer Marketing Factory
TikTok, Instagram & YouTube CampaignsA full-service agency with strong TikTok expertise, offering end-to-end campaign management from influencer discovery through performance reporting with a focus on platform-native content.Clients: Google, Snapchat, Universal Music, Bumble, YelpVisit TIMF → -
6

NeoReach
Enterprise Analytics & Influencer CampaignsAn enterprise-focused agency combining managed campaigns with a powerful self-service data platform for influencer search, audience analytics, and attribution modeling.Clients: Amazon, Airbnb, Netflix, Honda, The New York TimesVisit NeoReach → -
7
Ubiquitous
Creator-First Marketing PlatformA tech-driven platform combining self-service tools with managed campaign options, emphasizing speed and scalability for brands managing multiple influencer relationships.Clients: Lyft, Disney, Target, American Eagle, NetflixVisit Ubiquitous → -
8

Obviously
Scalable Enterprise Influencer CampaignsA tech-enabled agency built for high-volume campaigns, coordinating hundreds of creators simultaneously with end-to-end logistics, content rights management, and product seeding.Clients: Google, Ulta Beauty, Converse, AmazonVisit Obviously →