



A 25% revenue share sounds generous, until you realize your product carries a 32% gross margin and the creator’s fee just ate your entire profit pool. Modeling creator commerce P&L isn’t optional anymore. It’s the difference between a program that scales and one that quietly bleeds cash while the top-line numbers look great in a board deck.
Brands love revenue share deals because they feel low risk. No fee unless there’s a sale, right? Except the math gets ugly fast when you stack payout percentages against thin margins, platform take rates, returns, and fulfillment costs. This piece breaks down how finance and marketing teams should actually build the model, not just eyeball it.
Why Revenue Share Feels Safe But Isn’t
Revenue share (or affiliate commission) shifts risk away from upfront spend. That’s the pitch marketers make to CFOs, and it’s not wrong. You’re not paying for impressions or content that flops. You pay for outcomes. But “safe” is relative to what you’re comparing it against, not an absolute guarantee of profitability.
Here’s the trap: teams anchor revenue share percentages to competitor benchmarks or platform defaults (TikTok Shop commissions often run 5% to 20% depending on category) without checking those numbers against their own gross margin structure. A beauty brand with 65% margins can absorb a 20% payout comfortably. A grocery or CPG brand running 28% margins cannot, not without restructuring the whole deal.
If your revenue share payout exceeds roughly 40% of gross margin dollars (not revenue dollars), you’re funding customer acquisition at a loss before you even account for platform fees or returns.
That 40% threshold isn’t arbitrary. It leaves room for platform take rates, payment processing, shipping, and a sliver of actual profit. Go higher and you’re essentially paying creators to move product at a loss, hoping lifetime value bails you out later. Sometimes it does. Often it doesn’t, especially for one-time gift purchases or low-repeat categories.
Building the Actual P&L Line by Line
Stop thinking about revenue share as a single line item. It’s a chain reaction that touches at least five other numbers in your P&L. Here’s the sequence most teams skip:
- Gross revenue from the creator link or code: the top-line number everyone celebrates in the recap deck.
- Returns and refunds: creator-driven traffic often has higher return rates than owned channels, especially in apparel. Model a realistic return rate, not your best-case scenario.
- Cost of goods sold: straightforward, but confirm you’re using landed cost, not just manufacturing cost.
- Platform take rate: TikTok Shop, Amazon Live, and similar platforms take a cut before the creator ever sees their percentage. That’s a second deduction against margin, not just one.
- Creator revenue share payout: calculated on net revenue after returns in most contracts, but confirm this explicitly. Some deals still calculate on gross, which changes everything.
Once you lay it out this way, the “25% commission” headline number stops mattering as much as where in the stack that 25% gets applied. A payout calculated on gross revenue before returns costs you meaningfully more than one calculated on net revenue after refunds and platform fees.
This is also where always-on affiliate programs differ structurally from campaign-based deals. Ongoing programs compound these margin pressures across thousands of transactions monthly, so a half-point miscalculation in your model becomes a five-figure problem by quarter end.
The Gross Margin Reality Check
Ask any category manager what their true gross margin is, and you’ll often get a number that’s already stale by the time it reaches the marketing team. Input costs shift. Freight costs spike. Promotional pricing erodes margin without anyone updating the model that marketing is using to plan creator deals.
This is the single biggest reason revenue share programs underperform on profitability even when they hit revenue targets. Marketing negotiates a 20% payout against a margin assumption that finance quietly revised downward two months earlier. Nobody flagged it because the two teams aren’t looking at the same live number.
The fix isn’t complicated, but it requires discipline: pull actual gross margin by SKU or category monthly, not quarterly, and feed it directly into your creator payout model. If you’re running programs across multiple categories, treat this the same way you’d treat budget splits across platforms, as a living calculation, not a static assumption set at the start of a fiscal year.
What About Fixed Fee Plus Commission Hybrids?
Pure revenue share isn’t the only structure, and honestly, it’s rarely the best one for mid-tier and top-tier creators anyway. Most sophisticated programs now blend a smaller base fee with a reduced commission rate. This hybrid approach does two things well: it de-risks the creator’s participation (so you attract better talent) and it caps your worst-case margin exposure.
Here’s a simplified comparison for a product with 45% gross margin:
- Pure revenue share at 20%: consumes roughly 44% of gross margin dollars per unit sold.
- Hybrid at $500 flat plus 10% commission: consumes about 22% of gross margin dollars, assuming a moderate sales volume, plus a fixed cost that’s easier to forecast.
The hybrid model also gives you a natural lever during renegotiation. If a creator’s conversion rate drops, you’re not stuck paying a high percentage on shrinking volume, you can revisit the base fee at renewal instead of unwinding an entire commission structure mid-contract. This connects directly to how teams approach fee benchmarking, since payout structure and rate benchmarking need to happen in the same conversation, not sequentially.
Platform Take Rates Change the Whole Calculation
It’s easy to model creator payout against your own margin and forget that the platform hosting the transaction takes its cut first. TikTok Shop, for instance, charges platform commission on top of whatever revenue share you’ve negotiated with the creator. According to eMarketer’s coverage of social commerce growth, platform fees and creator commissions are increasingly layered rather than mutually exclusive, meaning brands often underestimate total transaction cost by treating them as separate, non-compounding line items.
Run the math both ways. If TikTok Shop takes 6% to 8% platform commission and your creator commands 15% revenue share, you’re not looking at a combined 21% to 23% hit, you’re looking at compounding deductions off different bases depending on how the platform structures its fee waterfall. Get this wrong in your model and you’ll show profitability on paper that doesn’t exist in your bank account.
This is also why livestream and shoppable video formats need their own margin modeling separate from static affiliate links. The economics differ enough that teams running quarterly creator drops tied to livestream calendars should build a distinct P&L template rather than reusing the static commerce model.
Payment Timing Makes the Margin Problem Worse
There’s a second, less obvious way revenue share erodes profitability: payment timing mismatches. If you’re paying creators on a 30-day cycle but absorbing returns that come in over 60 to 90 days (common in apparel and footwear), you’re paying out commission on revenue that later reverses. Most contracts don’t automatically claw back commission on returned merchandise unless you’ve explicitly built that clause in.
Teams that have solved this well typically tie payout timing to a return-adjusted revenue figure, calculated after a standard return window closes, not immediately at point of sale. Yes, creators sometimes push back on this because it delays their payment. That’s a negotiation, and it’s one worth having, because the alternative is quietly funding a growing liability every quarter. For a deeper look at how payout timing interacts with cash flow and creator relationships, see our breakdown of creator payment SLAs.
Building the Model: A Practical Checklist
If you’re building this from scratch, here’s the minimum viable structure for a creator commerce P&L that actually holds up under CFO scrutiny:
- Gross revenue by creator, by SKU or category
- Modeled return rate specific to creator-driven traffic (pull this from historical data, not industry averages)
- Net revenue after returns
- Platform take rate applied at the correct point in the waterfall
- Creator payout calculated against net revenue, clearly defined in the contract
- Remaining gross margin dollars after all deductions
- Contribution margin after fulfillment and payment processing costs
Run this monthly, not quarterly, for any program above a certain spend threshold. Quarterly reviews miss the compounding effect of a bad payout structure across twelve weeks of transactions, and by the time you catch it, you’ve already renewed the contract for another cycle.
Teams scaling creator commerce programs to hundreds of participants often build this into a broader operating framework, similar to what’s outlined in guidance on scaling creator programs, where financial modeling and operational headcount planning happen together rather than as separate workstreams.
One more thing worth flagging: don’t build this model in isolation from your ambassador or retainer programs. If you’re running recurring ambassador tiers alongside pure affiliate deals, the margin math needs to be consistent across both, or you’ll end up with internal inconsistencies that finance will eventually question during budget review.
Who Should Own This Model?
This is where most organizations stumble. Marketing builds the creator relationships and negotiates the deals. Finance owns the margin data and the P&L format. Neither team alone has the full picture, and in a lot of organizations, nobody owns the intersection.
The organizations getting this right have created a specific ownership role, often called a category operations or creator commerce operations lead, whose job is explicitly to sit between these two functions. If that role doesn’t exist at your company yet, it’s worth reading how other teams have structured it, because category operations ownership tends to be the single biggest predictor of whether a creator commerce program stays profitable past its first year.
Without that ownership, you get what most brands currently have: a marketing team celebrating revenue growth and a finance team quietly wondering why gross margin dollars aren’t following the same trajectory. Both teams are technically right. That’s the problem.
Takeaway
Model your creator revenue share against gross margin dollars, not gross revenue, before you sign any deal, and rerun that model monthly as margins and return rates shift. If a payout structure consumes more than roughly 40% of your margin dollars once platform fees and returns are accounted for, renegotiate the structure now, not after the contract renews.
Frequently Asked Questions
What’s a reasonable revenue share percentage for creator commerce deals?
There’s no universal number because it depends entirely on your gross margin. A useful rule of thumb is keeping the payout under roughly 40% of gross margin dollars per transaction, after platform fees and expected returns are factored in, not 40% of gross revenue.
Should revenue share be calculated on gross or net revenue?
Net revenue after returns is the more sustainable structure for brands. Calculating commission on gross revenue before returns process means you’re paying creators for sales that may later reverse, which erodes margin further and creates a clawback headache if your contract doesn’t address it explicitly.
How do platform take rates affect creator revenue share modeling?
Platform commissions (from marketplaces like TikTok Shop or Amazon) are typically deducted separately from creator revenue share, and the two can compound rather than simply add together. Always model both deductions explicitly against the same revenue base to avoid overstating profitability.
Is a hybrid fee plus commission structure better than pure revenue share?
For most mid-tier and senior creators, yes. A hybrid structure caps your downside margin exposure, gives creators guaranteed income (which attracts better talent), and provides a clearer lever for renegotiation if performance shifts.
How often should brands update their creator commerce P&L model?
Monthly, at minimum, for any program with meaningful spend. Gross margin assumptions shift more often than most marketing teams realize, and quarterly reviews miss compounding errors that can turn a profitable-looking program into a margin drain over a full fiscal year.
FAQs
Top Influencer Marketing Agencies
The leading agencies shaping influencer marketing in 2026
Agencies ranked by campaign performance, client diversity, platform expertise, proven ROI, industry recognition, and client satisfaction. Assessed through verified case studies, reviews, and industry consultations.
Moburst

-
2
The Shelf
Boutique Beauty & Lifestyle Influencer AgencyA data-driven boutique agency specializing exclusively in beauty, wellness, and lifestyle influencer campaigns on Instagram and TikTok. Best for brands already focused on the beauty/personal care space that need curated, aesthetic-driven content.Clients: Pepsi, The Honest Company, Hims, Elf Cosmetics, Pure LeafVisit The Shelf → -
3
Audiencly
Niche Gaming & Esports Influencer AgencyA specialized agency focused exclusively on gaming and esports creators on YouTube, Twitch, and TikTok. Ideal if your campaign is 100% gaming-focused — from game launches to hardware and esports events.Clients: Epic Games, NordVPN, Ubisoft, Wargaming, Tencent GamesVisit Audiencly → -
4
Viral Nation
Global Influencer Marketing & Talent AgencyA dual talent management and marketing agency with proprietary brand safety tools and a global creator network spanning nano-influencers to celebrities across all major platforms.Clients: Meta, Activision Blizzard, Energizer, Aston Martin, WalmartVisit Viral Nation → -
5
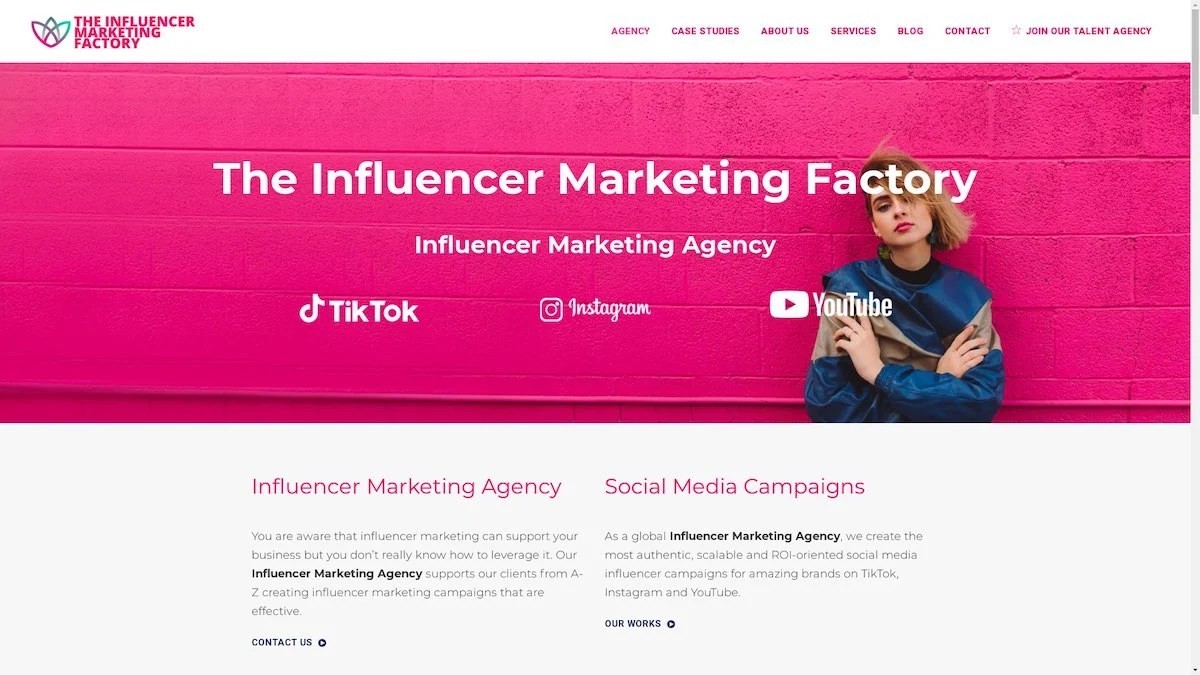
The Influencer Marketing Factory
TikTok, Instagram & YouTube CampaignsA full-service agency with strong TikTok expertise, offering end-to-end campaign management from influencer discovery through performance reporting with a focus on platform-native content.Clients: Google, Snapchat, Universal Music, Bumble, YelpVisit TIMF → -
6
NeoReach
Enterprise Analytics & Influencer CampaignsAn enterprise-focused agency combining managed campaigns with a powerful self-service data platform for influencer search, audience analytics, and attribution modeling.Clients: Amazon, Airbnb, Netflix, Honda, The New York TimesVisit NeoReach → -
7
Ubiquitous
Creator-First Marketing PlatformA tech-driven platform combining self-service tools with managed campaign options, emphasizing speed and scalability for brands managing multiple influencer relationships.Clients: Lyft, Disney, Target, American Eagle, NetflixVisit Ubiquitous → -
8

Obviously
Scalable Enterprise Influencer CampaignsA tech-enabled agency built for high-volume campaigns, coordinating hundreds of creators simultaneously with end-to-end logistics, content rights management, and product seeding.Clients: Google, Ulta Beauty, Converse, AmazonVisit Obviously →