



Here’s an uncomfortable number for anyone still reporting on likes: a save on Instagram correlates with purchase intent at roughly four times the rate of a like, according to internal platform data shared with agency partners. Yet most influencer programs still can’t tell you their cost per save, let alone their cost per inbound conversation. If you’re benchmarking creator spend against reach and engagement alone, you’re flying blind on the metrics that actually predict revenue.
Why Saves and DMs Beat Likes as a Buying Signal
Likes are a reflex. Saves and inbound messages are a decision. Someone who saves a post is bookmarking it for later, often with intent to buy, research, or share with a partner before a purchase. Someone who slides into your brand’s DMs after watching a creator video has effectively raised their hand. That’s a warmer lead than almost anything a display ad will generate.
The problem is that most measurement frameworks still treat these as vanity metrics, buried under reach and impressions in a monthly deck. Marketers who’ve shifted budget toward creators specifically because of save and conversation behavior are seeing lower blended CAC, but only when they track cost per action with the same rigor they’d apply to a paid search campaign.
A brand spending $18,000 on a TikTok creator tier that drives 4,200 saves and 310 inbound DMs has a materially different ROI story than one spending the same budget on reach alone, even if the impression counts look identical on a dashboard.
Building a Cost Per Save Benchmark That Actually Holds Up
Cost per save is simple math: total campaign spend divided by total saves attributed to that spend. The complexity is in getting clean, comparable data across platforms that don’t report saves the same way.
- Instagram surfaces saves in both organic insights and branded content ads reporting, making it the easiest platform to benchmark.
- Pinterest treats saves (pins) as a primary engagement unit, so benchmarks here tend to run lower in cost per save because the platform’s entire architecture is built around bookmarking behavior.
- TikTok only recently normalized save data in its creator marketplace reporting, and benchmarks are still noisy because save behavior varies wildly by content format (tutorial content saves at a much higher rate than trend-based content).
- YouTube doesn’t have a native save equivalent in the same sense, so teams often proxy with “add to watch later” or playlist adds, which skews comparisons if you’re not careful about labeling it separately.
A realistic cross-platform benchmark range, based on aggregated agency reporting across mid-tier campaigns (think $5,000 to $50,000 in spend), puts Pinterest cost per save in the $0.15 to $0.40 range, Instagram in the $0.35 to $0.90 range, and TikTok in the $0.60 to $1.50 range depending on niche and creator tier. Those numbers move fast with seasonality, so treat them as a starting line, not gospel.
If you’re trying to pressure-test whether a vendor’s save numbers are real or inflated by bot activity, it’s worth cross-referencing with fraud detection tooling before you lock in a benchmark. The same scrutiny that applies to live shopping engagement applies here, and fraud detection for TikTok Shop methodology is a useful template for auditing save authenticity on other formats too.
Cost Per Inbound Conversation: The Metric Sales Actually Cares About
Cost per inbound conversation measures something different and, frankly, harder to track: how much you’re spending to generate a direct, two-way interaction initiated by the audience. That’s a DM, a comment that turns into a thread, a “link in bio” click that lands on a contact form, or a creator-driven referral that shows up in your CRM tagged with source data.
This metric matters most for brands selling considered purchases: B2B software, high-ticket consumer goods, services, anything with a sales cycle longer than an impulse buy. A viral video with no inbound conversations is a vanity win. A modest-reach video that generates forty genuine inbound inquiries might be your best-performing asset of the quarter.
The challenge is attribution. Unless you’re using unique tracking links, UTM-tagged bios, or platform-native lead forms, inbound conversations get lost in the noise of general DM volume. Brands that have wired their CRM creator pipelines directly into campaign reporting are the ones who can actually produce a defensible cost per inbound conversation number. Everyone else is estimating.
Platform by Platform: Where the Numbers Actually Land
Benchmarks only matter in context, so here’s a rough breakdown by platform, built from campaign data pooled across consumer and B2B verticals. These are not universal truths. They shift based on creator tier, vertical, and whether you’re running whitelisted ads behind the content.
- Instagram: Cost per inbound conversation typically runs $3 to $9 for consumer brands using mid-tier creators (50k to 500k followers). DM volume spikes when creators include a direct call to action rather than a generic “link in bio.”
- TikTok: Lower cost per save but higher cost per inbound conversation, often $6 to $14, because TikTok’s audience skews toward passive consumption over direct outreach unless the content format explicitly invites comments or shares.
- LinkedIn: For B2B brands running thought-leadership or creator-adjacent campaigns, cost per inbound conversation can run $25 to $60, but the leads tend to be higher intent and more sales-qualified.
- YouTube: Inbound conversation cost varies enormously by format. Long-form review content tends to drive lower-cost, higher-intent conversations than Shorts.
According to eMarketer research on social commerce behavior, platforms optimized for discovery versus save-and-return behavior produce fundamentally different funnel shapes, which is exactly why a flat cross-platform CPM comparison misleads more than it informs.
Why the Same Spend Produces Wildly Different Outcomes
Two campaigns, identical budgets, wildly different outcomes. That’s the reality once you start tracking saves and inbound conversations instead of reach. A $20,000 Pinterest campaign targeting home decor searchers might generate triple the saves of an Instagram campaign at the same spend, but a tenth of the inbound DMs, because Pinterest users are in research mode, not conversation mode.
This is where benchmarking gets genuinely useful for budget allocation. If your brand’s goal is top-of-funnel consideration and retargeting pool growth, optimize toward cost per save and lean into Pinterest and Instagram. If your goal is pipeline generation, optimize toward cost per inbound conversation and lean into platforms where creators drive direct audience interaction, which tends to favor TikTok comment sections and LinkedIn creator posts for B2B.
Teams that benchmark cost per save and cost per inbound conversation separately, rather than blending them into a single “engagement cost” metric, make dramatically better platform allocation decisions quarter over quarter.
Where These Benchmarks Break Down
No benchmark survives contact with messy data, and this category has more measurement gaps than most. A few recurring failure points worth flagging for your compliance and analytics teams:
- Platform self-reporting bias. Save and DM counts reported inside a platform’s own ad manager aren’t independently audited, so treat vendor-supplied numbers with the same skepticism you’d apply to any incrementality proof claim.
- Bot-inflated engagement. Saves can be gamed through engagement pods and automation, particularly on TikTok and Instagram. If a creator’s save rate is 3x their category average, dig before you benchmark against it.
- Attribution overlap. If multiple creators are running simultaneously, inbound conversations get misattributed unless you’re using creator-specific tracking links or clean room matching to separate signal from noise.
- Seasonality distortion. Cost per save and cost per inbound conversation both swing hard during Q4, when creator rates spike and audience attention fragments. If you’re benchmarking historical data against a holiday campaign, you’re comparing apples to a different fruit entirely. Cross-check against rate benchmarking tools built specifically for that window.
Regulatory risk is worth a mention here too. The FTC’s influencer disclosure guidance doesn’t directly govern how you measure saves or DMs, but any campaign generating inbound conversations that lead to purchase claims needs the same disclosure rigor as any other sponsored content, especially if creators are responding to DMs on the brand’s behalf.
Operationalizing the Benchmark Without Building a Dashboard from Scratch
You don’t need a custom BI build to start tracking this. Most teams can get 80% of the way there with UTM-tagged bio links, platform-native insights exports, and a shared tracking sheet that separates saves from likes and inbound DMs from general comment volume. The teams getting the cleanest read are increasingly consolidating this inside unified creator and paid media dashboards that pull save and conversation data alongside spend in one view, rather than stitching together five platform exports every Friday.
For benchmarking purposes specifically, set a quarterly cadence. Pull cost per save and cost per inbound conversation by platform and creator tier, compare against your own trailing average rather than industry-wide numbers (which vary too much by vertical to be reliable), and flag any outliers for a fraud or attribution audit before you scale spend based on them. Sprout Social’s engagement benchmarking research is a reasonable external sanity check if you want a second data point beyond your own campaigns.
Next step: Pull your last two quarters of creator spend, separate saves and inbound DMs from your general engagement totals, and calculate cost per action by platform before your next budget cycle. If the numbers surprise you, that’s the benchmark doing its job.
FAQs
What counts as a “save” versus a “like” for benchmarking purposes?
A save is a deliberate bookmarking action (Instagram saves, Pinterest pins, YouTube playlist adds), indicating intent to revisit content, while a like is a passive reaction. Saves generally correlate more closely with purchase intent, which is why they deserve separate tracking.
How do I calculate cost per inbound conversation accurately?
Divide total campaign spend by the number of audience-initiated interactions (DMs, qualifying comments, inbound form fills tagged to a creator link) that your CRM or platform analytics can directly attribute to that campaign. Unique tracking links per creator make this far more reliable.
Which platform typically has the lowest cost per save?
Pinterest usually produces the lowest cost per save because its core user behavior is built around bookmarking for later, though actual numbers vary significantly by vertical and creator tier.
Why does cost per inbound conversation matter more for B2B brands?
B2B purchases usually involve longer sales cycles, so a direct inbound conversation is a stronger lead indicator than reach or engagement. Tracking this cost helps B2B marketers justify influencer spend against pipeline generation rather than brand awareness alone.
How often should these benchmarks be updated?
Quarterly is a reasonable baseline, though brands running high-volume always-on programs may benefit from monthly reviews, especially heading into Q4 when creator rates and platform behavior both shift quickly.
Top Influencer Marketing Agencies
The leading agencies shaping influencer marketing in 2026
Agencies ranked by campaign performance, client diversity, platform expertise, proven ROI, industry recognition, and client satisfaction. Assessed through verified case studies, reviews, and industry consultations.
Moburst
-
2

The Shelf
Boutique Beauty & Lifestyle Influencer AgencyA data-driven boutique agency specializing exclusively in beauty, wellness, and lifestyle influencer campaigns on Instagram and TikTok. Best for brands already focused on the beauty/personal care space that need curated, aesthetic-driven content.Clients: Pepsi, The Honest Company, Hims, Elf Cosmetics, Pure LeafVisit The Shelf → -
3
Audiencly
Niche Gaming & Esports Influencer AgencyA specialized agency focused exclusively on gaming and esports creators on YouTube, Twitch, and TikTok. Ideal if your campaign is 100% gaming-focused — from game launches to hardware and esports events.Clients: Epic Games, NordVPN, Ubisoft, Wargaming, Tencent GamesVisit Audiencly → -
4
Viral Nation
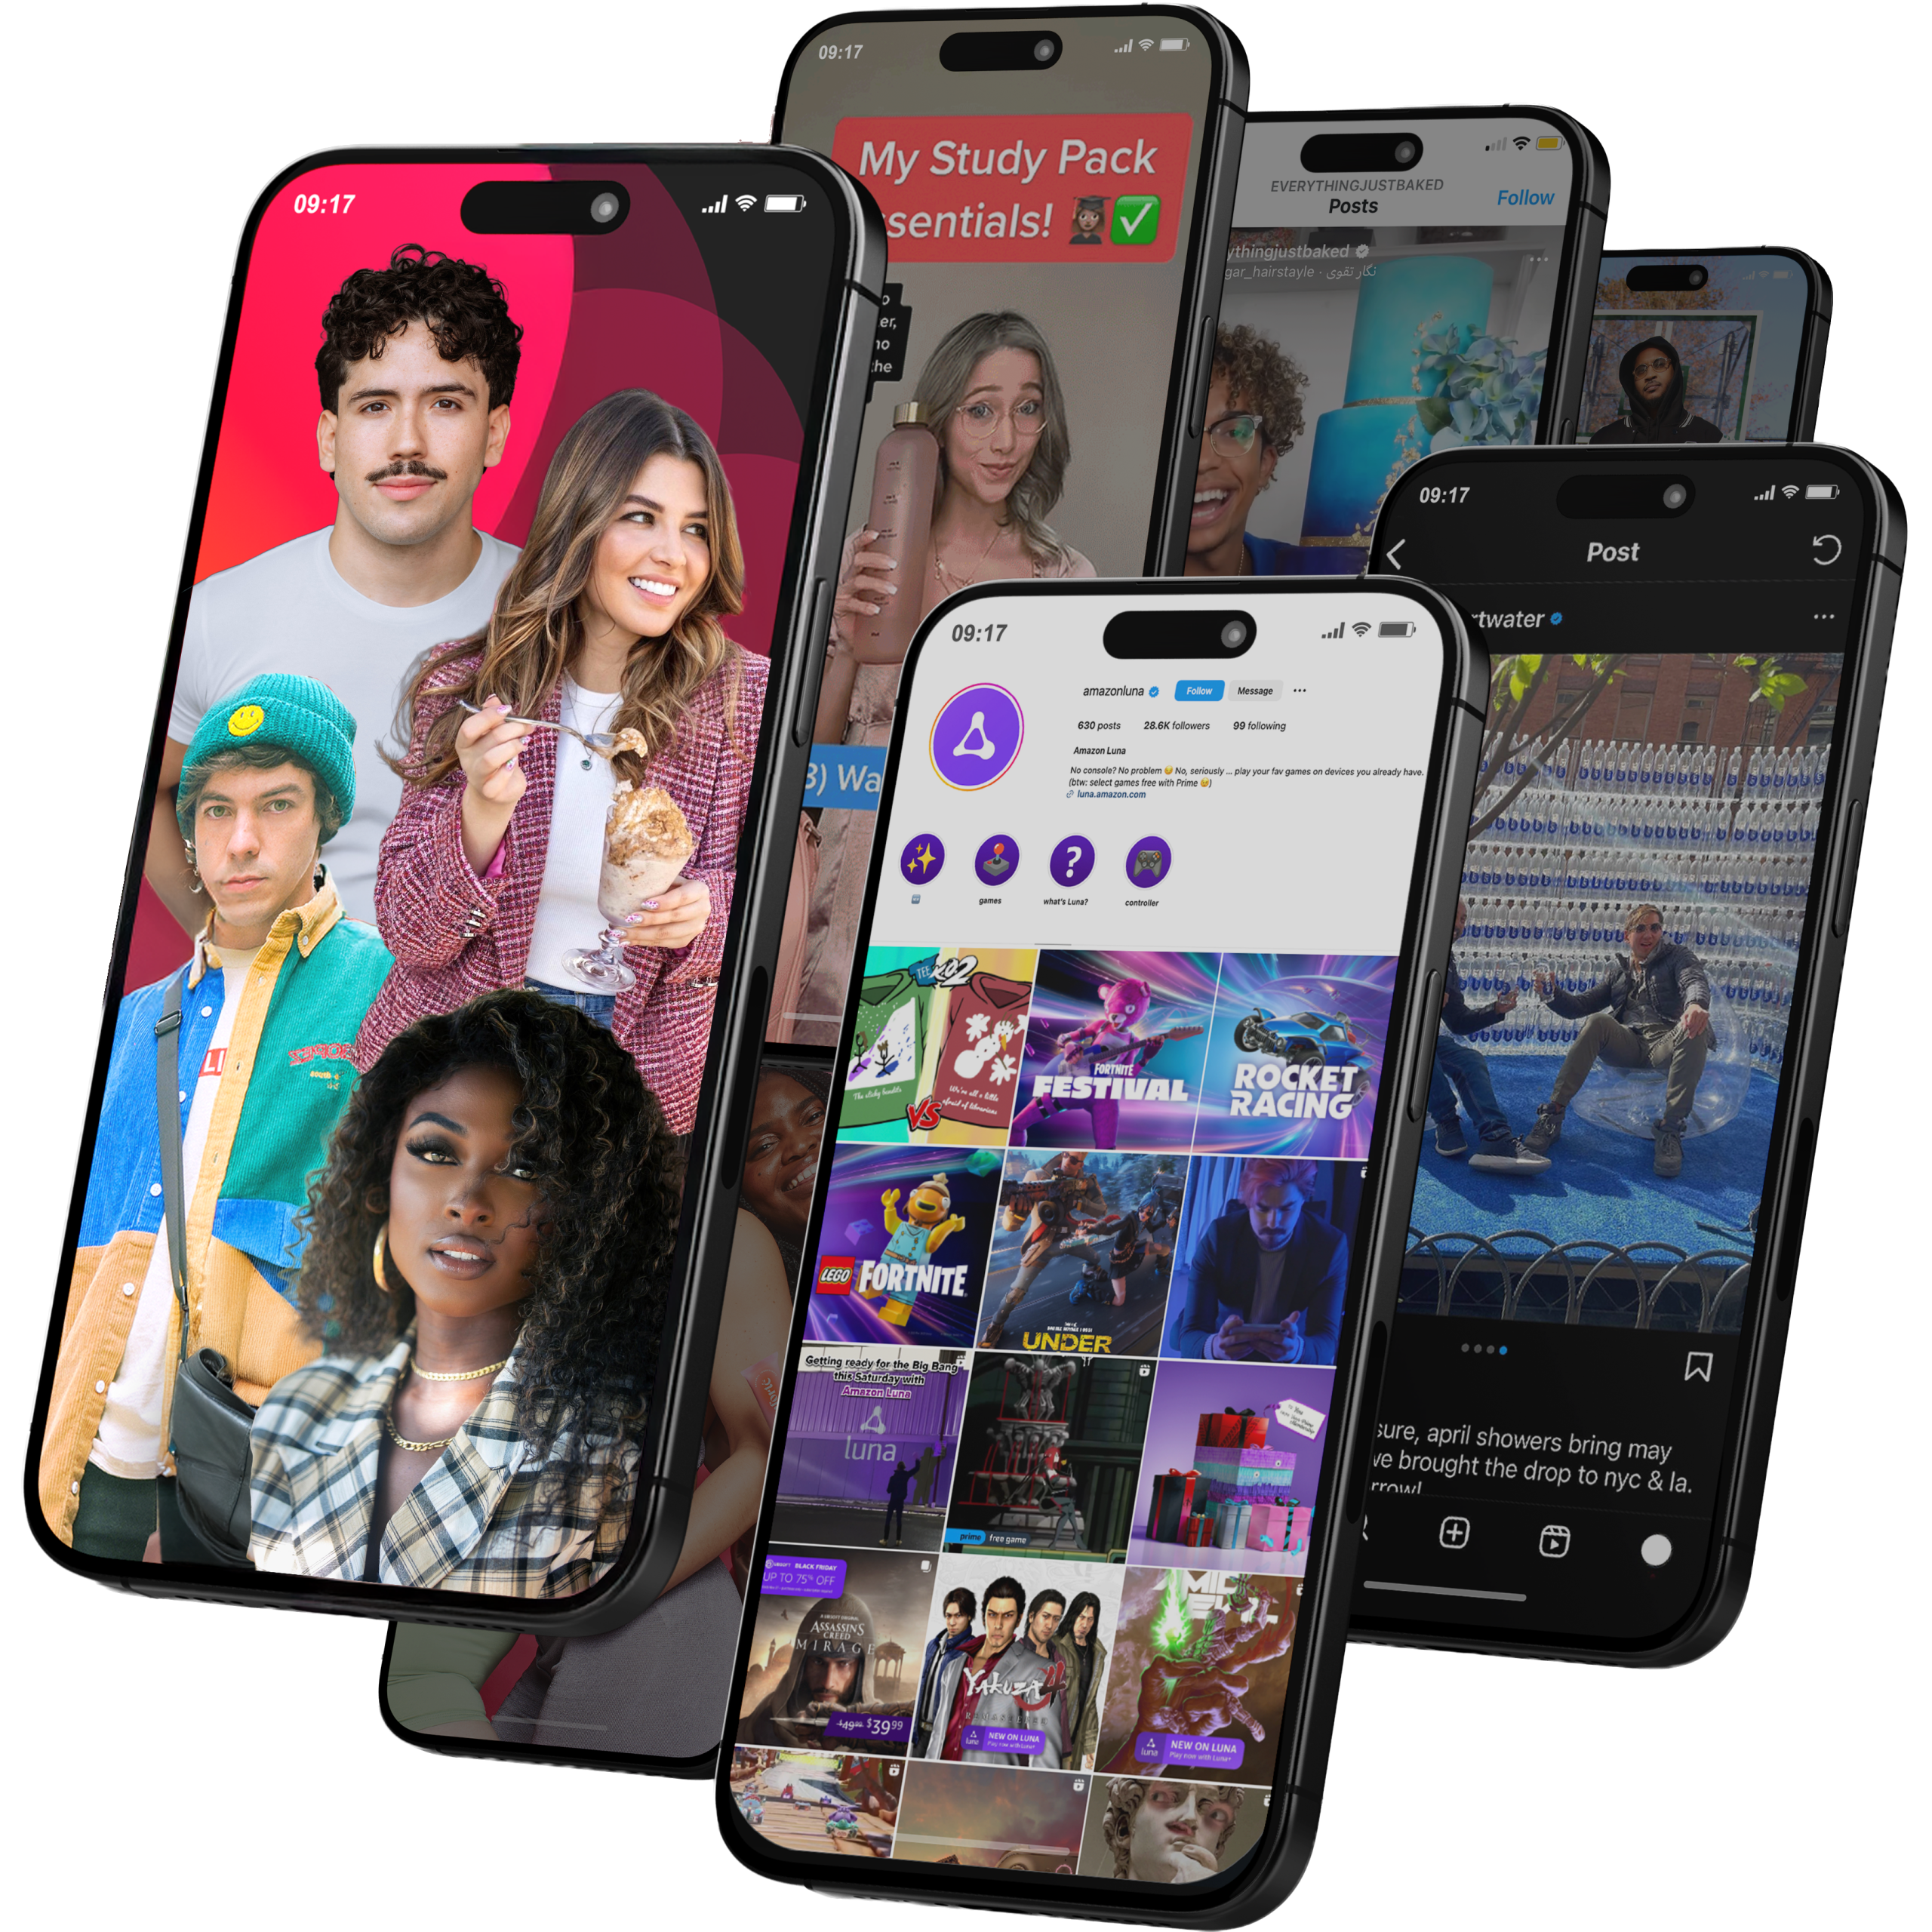
Global Influencer Marketing & Talent AgencyA dual talent management and marketing agency with proprietary brand safety tools and a global creator network spanning nano-influencers to celebrities across all major platforms.Clients: Meta, Activision Blizzard, Energizer, Aston Martin, WalmartVisit Viral Nation → -
5
The Influencer Marketing Factory
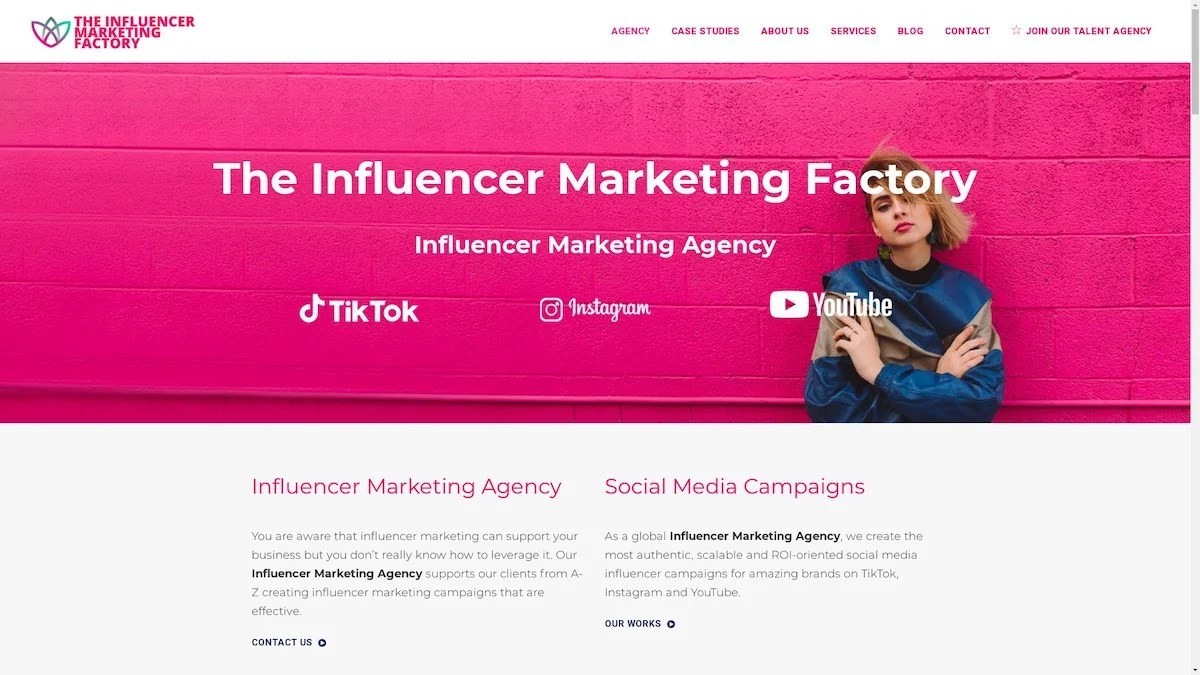
TikTok, Instagram & YouTube CampaignsA full-service agency with strong TikTok expertise, offering end-to-end campaign management from influencer discovery through performance reporting with a focus on platform-native content.Clients: Google, Snapchat, Universal Music, Bumble, YelpVisit TIMF → -
6
NeoReach
Enterprise Analytics & Influencer CampaignsAn enterprise-focused agency combining managed campaigns with a powerful self-service data platform for influencer search, audience analytics, and attribution modeling.Clients: Amazon, Airbnb, Netflix, Honda, The New York TimesVisit NeoReach → -
7
Ubiquitous
Creator-First Marketing PlatformA tech-driven platform combining self-service tools with managed campaign options, emphasizing speed and scalability for brands managing multiple influencer relationships.Clients: Lyft, Disney, Target, American Eagle, NetflixVisit Ubiquitous → -
8

Obviously
Scalable Enterprise Influencer CampaignsA tech-enabled agency built for high-volume campaigns, coordinating hundreds of creators simultaneously with end-to-end logistics, content rights management, and product seeding.Clients: Google, Ulta Beauty, Converse, AmazonVisit Obviously →