



Sixty-eight percent of shoppers say price is the top factor in a purchase decision, according to Statista consumer research. So why do premium brands keep leading with features instead of math? The price-per-use breakdown format flips the script: it puts a calculator on screen and lets the audience do the arithmetic themselves.
This isn’t a new idea. Infomercials have used “just pennies a day” math since the 1980s. What’s changed is the execution: TikTok and Reels creators now do this live, with a notes app, a receipt, or literal on-screen text animations breaking down the cost. For value-positioned brands charging more upfront, this format is one of the few that turns a price objection into a closing argument.
Why “Expensive” Is a Framing Problem, Not a Pricing Problem
Every brand selling above the category median has heard some version of “why does this cost so much?” The instinct is to defend quality. Better materials. Better formulation. Better craftsmanship. All true, probably. But quality claims are subjective and hard to verify from a fifteen-second video. Math isn’t.
The price-per-use format sidesteps the quality argument entirely and replaces it with arithmetic the viewer can’t easily dispute. A $68 skincare serum sounds steep until a creator shows it lasts four months with twice-daily use, breaking down to $0.57 per application. Compare that to a $12 drugstore serum that runs out in three weeks. Suddenly the “expensive” product is the cheaper one.
When a brand shows its math instead of asserting its value, it shifts the burden of proof from marketing claims to arithmetic the viewer can verify themselves.
This matters more in categories where purchase hesitation is driven by sticker shock rather than skepticism about the product itself. Beauty, wellness, home goods, and premium apparel all lean on this psychology heavily.
What the Format Actually Looks Like on Screen
The mechanics are simple, which is exactly why it works. A creator holds the product, states the price, then walks through a use-case timeline with on-screen text or a visible calculator app doing the division in real time.
- State the sticker price upfront, no hedging.
- Show the expected lifespan or use count (with a source: package labeling, brand-stated shelf life, or personal testing).
- Do the division on screen. Literally show the calculator or the math being typed out.
- Compare to a cheaper alternative’s true cost-per-use, if relevant.
- Land on a per-use number small enough to feel trivial: “less than a coffee,” “cheaper than a vending machine snack.”
The comparison step is optional but powerful. It’s also where legal risk creeps in, more on that below. Done well, the format runs 20-40 seconds. Long enough to build the math, short enough that the platform’s algorithm doesn’t punish it for low completion rates.
Which Brands Should (and Shouldn’t) Use This
Price-per-use math works best for products with three characteristics: a clear usage cadence, a defined lifespan, and a premium price point relative to alternatives. Skincare, supplements, razors, coffee subscriptions, appliances, mattresses, even software with per-seat pricing — all fit naturally.
It works less well for one-time purchases with no repeat-use logic, or for impulse-priced items where the math doesn’t need explaining. Nobody needs a cost-per-use breakdown for a $6 lip balm. The format shines specifically where the price gap between premium and budget options is large enough to create hesitation, but where the actual math favors the premium option once amortized.
Brands should also be honest about lifespan estimates. If the brief asks a creator to claim a product “lasts six months” without internal testing or label data to back it up, that’s not a creative choice — it’s a liability. The FTC’s endorsement guidance is explicit that substantiation matters as much as disclosure. A made-up usage timeline dressed up as math is still a false claim, just with a calculator prop.
Writing the Brief: What to Specify and What to Leave Open
A good creative brief for this format gives creators the numbers and lets them build the narrative. Over-scripting the delivery kills the authenticity that makes cost breakdowns believable in the first place.
What the brief should lock down:
- The verified price and unit count. Don’t leave this to creator guesswork.
- The substantiated usage lifespan, sourced from internal testing, customer data, or label claims.
- The math itself, pre-calculated so creators aren’t doing division live and getting it wrong on camera.
- Comparison guardrails, if a competitor comparison is involved, per FTC comparative advertising rules.
- Required disclosure language, positioned clearly, not buried in a description box.
What the brief should leave open: tone, pacing, whether they use a literal calculator or a whiteboard or on-screen text, and how they frame the “aha” moment at the end. Creators know their audience’s attention span better than any brand strategist watching from a boardroom.
This is similar in spirit to how split-screen price comparison briefs work: give creators the verified numbers, let them own the delivery. The two formats pair well in a single content calendar, actually, since one shows relative price and the other shows absolute value over time.
The Comparison Trap: Where This Format Gets Brands in Trouble
The riskiest version of this format names a competitor and does side-by-side math. Legally, comparative advertising is allowed in the US as long as claims are truthful, substantiated, and not misleading by omission. But “technically legal” and “safe for a paid partnership” aren’t the same thing.
Common mistakes brands make when briefing comparison-heavy price-per-use content:
- Cherry-picking lifespan data. Using best-case usage for your product and worst-case for the competitor’s.
- Ignoring unit differences. Comparing a 30ml bottle to a 50ml bottle without normalizing the math.
- Skipping the disclosure entirely because the video “doesn’t feel like an ad.”
- Letting creators freelance the competitor comparison without brand or legal review.
If the goal is a comparison, it’s worth reviewing how the silent comparison format handles FTC risk without naming competitors directly. Sometimes the safer, and honestly more persuasive, move is comparing “premium option” versus “budget option” generically rather than naming brands. It keeps the legal exposure lower and keeps the focus on the math, not the shade.
Where This Format Fits in a Broader Content Mix
Price-per-use breakdowns work best as a mid-funnel format. Top-of-funnel content builds awareness; price-math content answers the specific objection that’s stopping a warm audience from converting. It’s not a discovery format, it’s a conviction format.
Brands running full-funnel creator programs often pair this with formats like price-tag reveal content earlier in the funnel to set price expectations, then use price-per-use math to close the deal once a viewer is already considering the purchase. Retargeting audiences with this specific format, rather than generic UGC, tends to perform better because it directly answers the “is this worth it” hesitation that shows up in cart abandonment data.
Sprout Social’s research on creator content consistently shows that specificity beats generality in conversion-focused UGC. Vague value claims underperform against demonstrable numbers. That’s the entire thesis behind this format: stop telling people something is worth it, show them the receipt.
Measuring Whether It’s Actually Working
Standard engagement metrics undersell this format. A price-per-use video won’t always get the highest view count or share rate compared to entertainment-driven content. What it should move is click-through rate on product links, add-to-cart rate, and — most importantly — post-purchase return rate.
If the math brief was honest, returns should stay flat or drop, because buyers arrived with accurate expectations about product lifespan. If returns spike after a price-per-use campaign, that’s a signal the usage claims in the brief were optimistic. Track this the way you’d track any performance format: link-in-bio clicks, UTM-tagged conversions, and a 30-60 day return-rate window against a control group that didn’t see the format.
Brands running affiliate or TikTok Shop programs should also watch conversion rate specifically on price-per-use content versus other formats in the same campaign. The data usually shows a wider gap in categories where price is the primary objection (skincare, supplements) versus categories where it’s secondary (fashion, snacks).
Next Step
Pull your last three months of creator content, isolate anything that mentions price or cost, and check conversion rate against your channel average. If price-per-use math outperforms, brief more of it, specifically, with verified numbers, not creator guesswork, going into every single asset.
FAQs
What is the price-per-use breakdown format in influencer marketing?
It’s a content format where a creator shows on-screen math dividing a product’s total price by its expected number of uses or lifespan, making the true cost-per-use visible to justify a premium price point.
Which product categories benefit most from this format?
Skincare, supplements, subscriptions, appliances, and any product with a clear, repeatable usage cadence and defined lifespan tend to perform best, since the math has something concrete to calculate against.
Is comparing your product’s cost-per-use to a competitor’s legally risky?
It can be, if the comparison isn’t substantiated or normalizes units unfairly. The FTC allows truthful comparative advertising, but brands should require documented data behind any competitor comparison and disclose the partnership clearly.
How do you verify the usage lifespan claims used in the video?
Use internal product testing, manufacturer shelf-life data, or aggregated customer usage data rather than creator estimation. Undocumented lifespan claims are one of the most common compliance risks in this format.
How long should a price-per-use video run?
Most effective versions run 20-40 seconds: long enough to build the math clearly, short enough to avoid completion-rate drop-off on short-form platforms.
How is this different from a standard price comparison video?
Standard price comparisons show sticker price side by side. Price-per-use breakdowns go a step further, dividing cost by usage over time to reveal the actual long-term value, which is often more persuasive for premium-priced products.
Top Influencer Marketing Agencies
The leading agencies shaping influencer marketing in 2026
Agencies ranked by campaign performance, client diversity, platform expertise, proven ROI, industry recognition, and client satisfaction. Assessed through verified case studies, reviews, and industry consultations.
Moburst

-
2

The Shelf
Boutique Beauty & Lifestyle Influencer AgencyA data-driven boutique agency specializing exclusively in beauty, wellness, and lifestyle influencer campaigns on Instagram and TikTok. Best for brands already focused on the beauty/personal care space that need curated, aesthetic-driven content.Clients: Pepsi, The Honest Company, Hims, Elf Cosmetics, Pure LeafVisit The Shelf → -
3

Audiencly
Niche Gaming & Esports Influencer AgencyA specialized agency focused exclusively on gaming and esports creators on YouTube, Twitch, and TikTok. Ideal if your campaign is 100% gaming-focused — from game launches to hardware and esports events.Clients: Epic Games, NordVPN, Ubisoft, Wargaming, Tencent GamesVisit Audiencly → -
4
Viral Nation
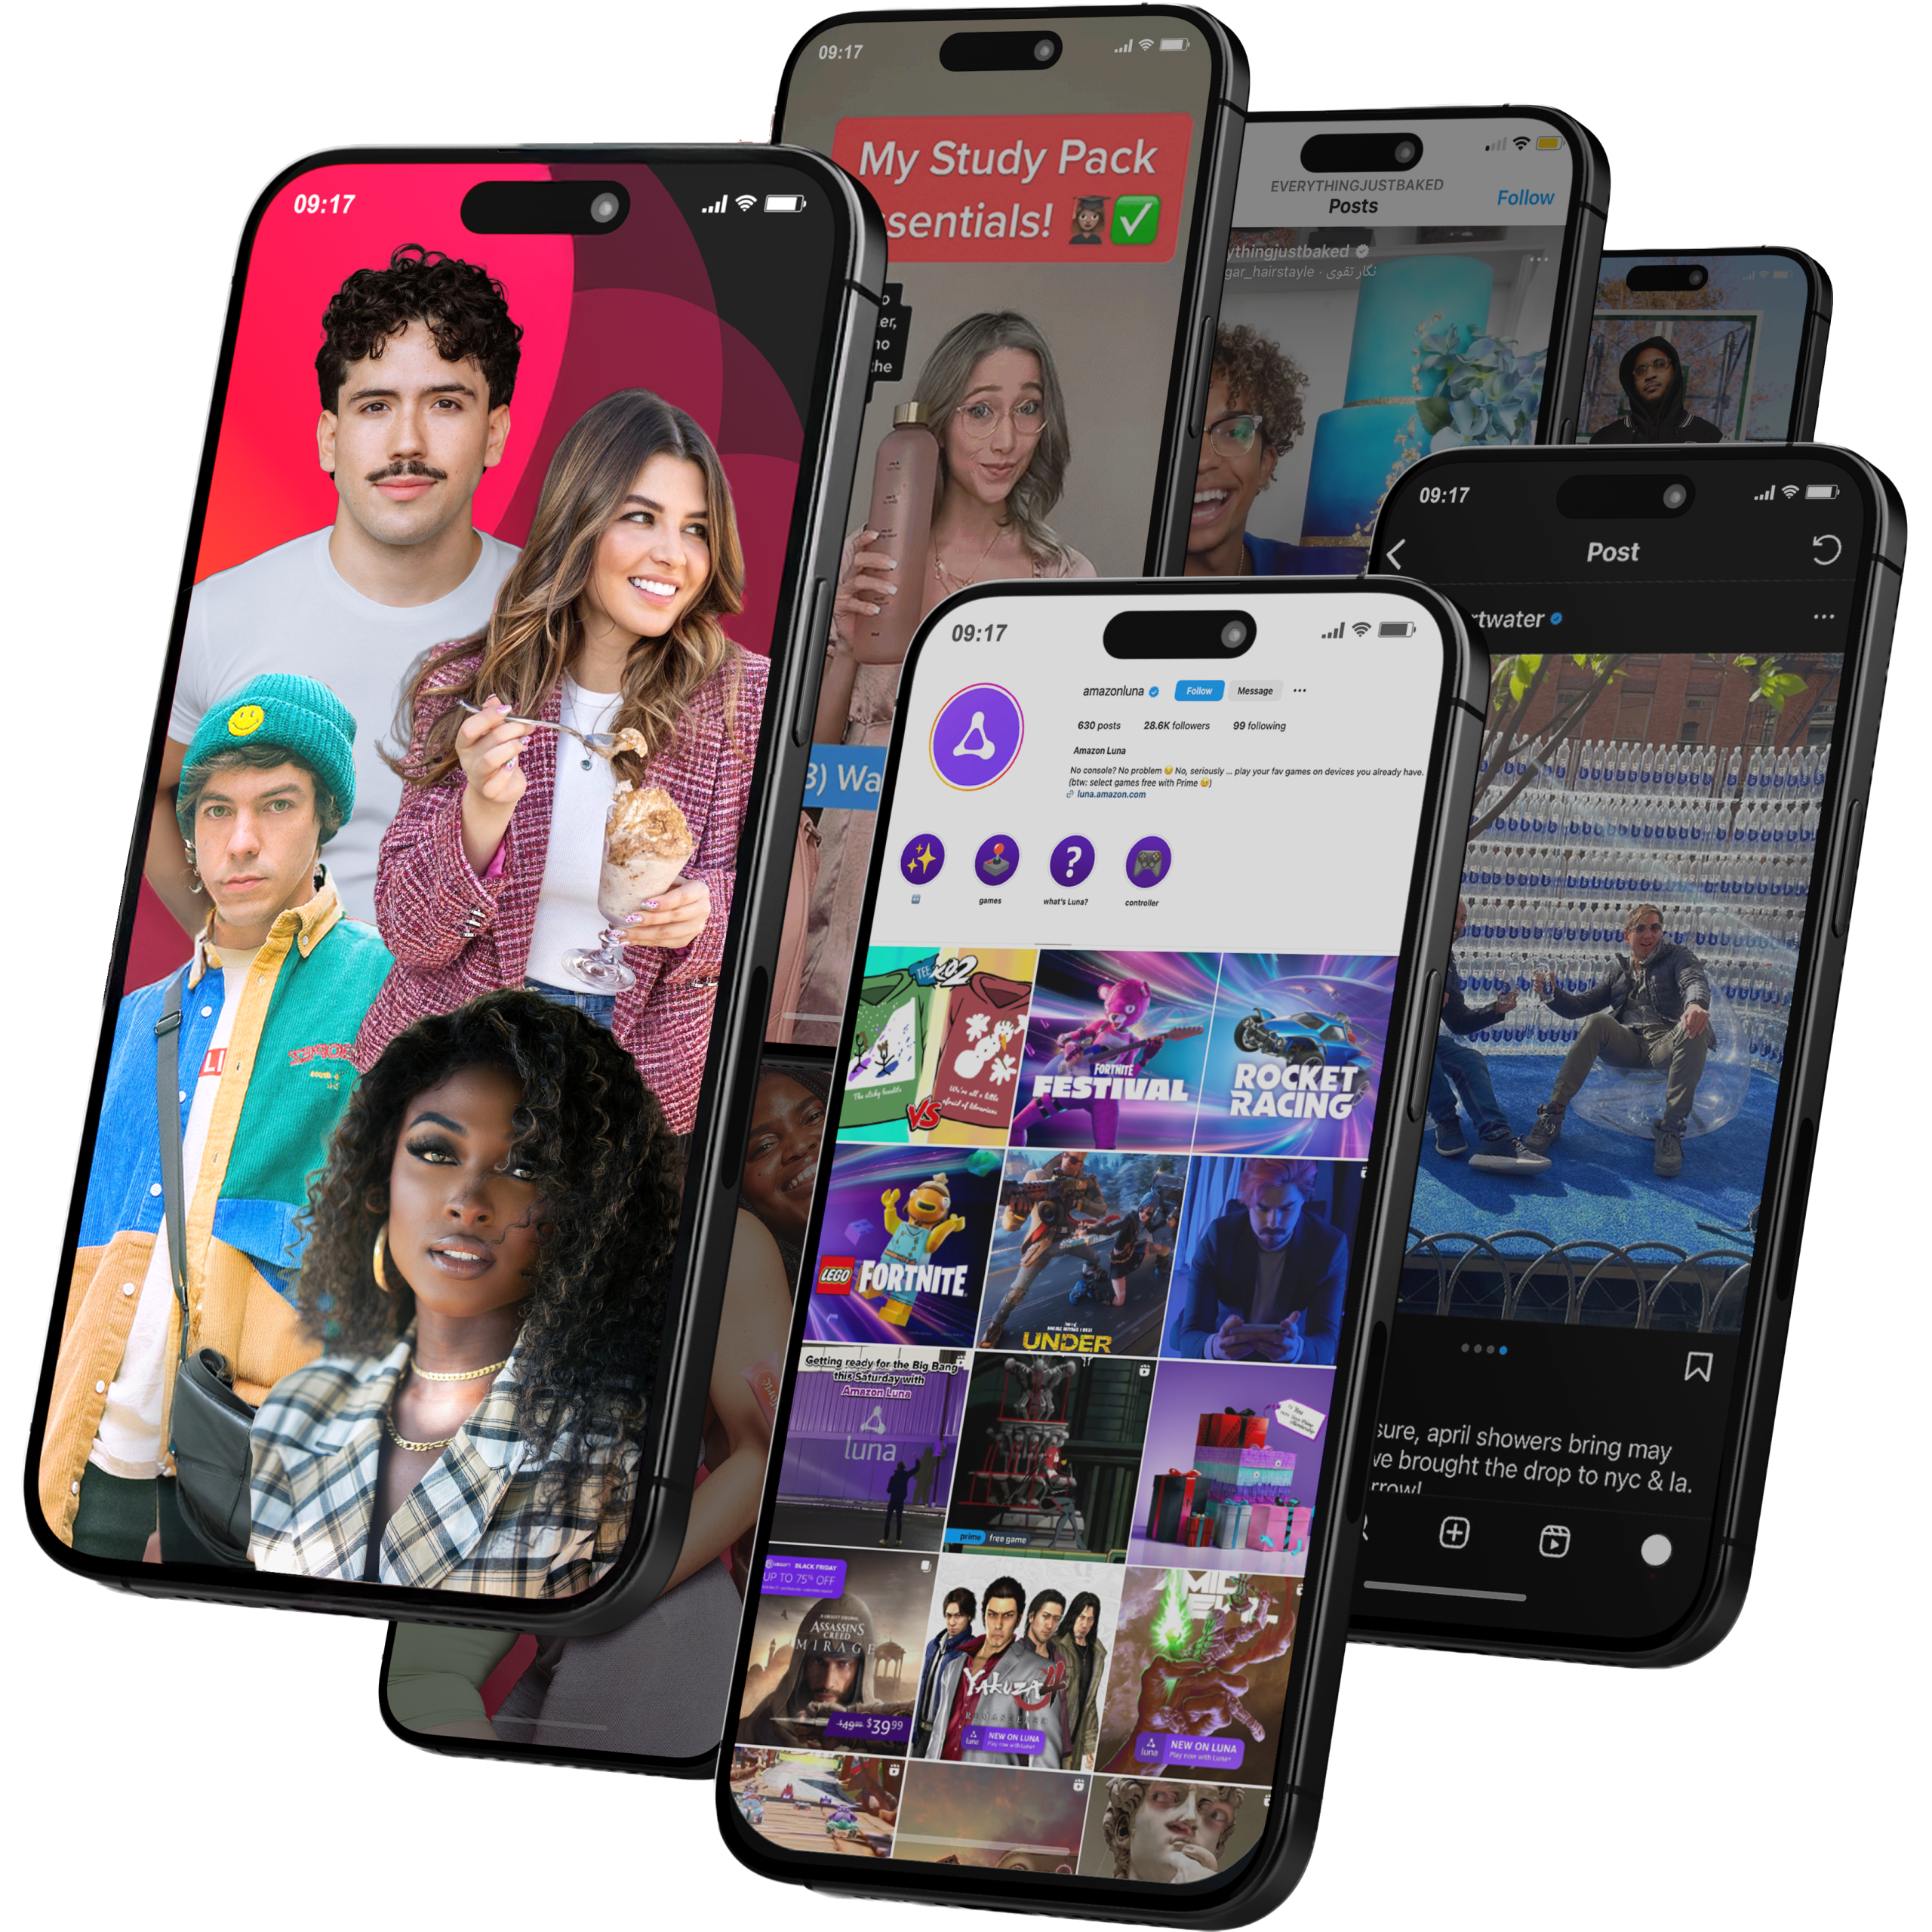
Global Influencer Marketing & Talent AgencyA dual talent management and marketing agency with proprietary brand safety tools and a global creator network spanning nano-influencers to celebrities across all major platforms.Clients: Meta, Activision Blizzard, Energizer, Aston Martin, WalmartVisit Viral Nation → -
5
The Influencer Marketing Factory
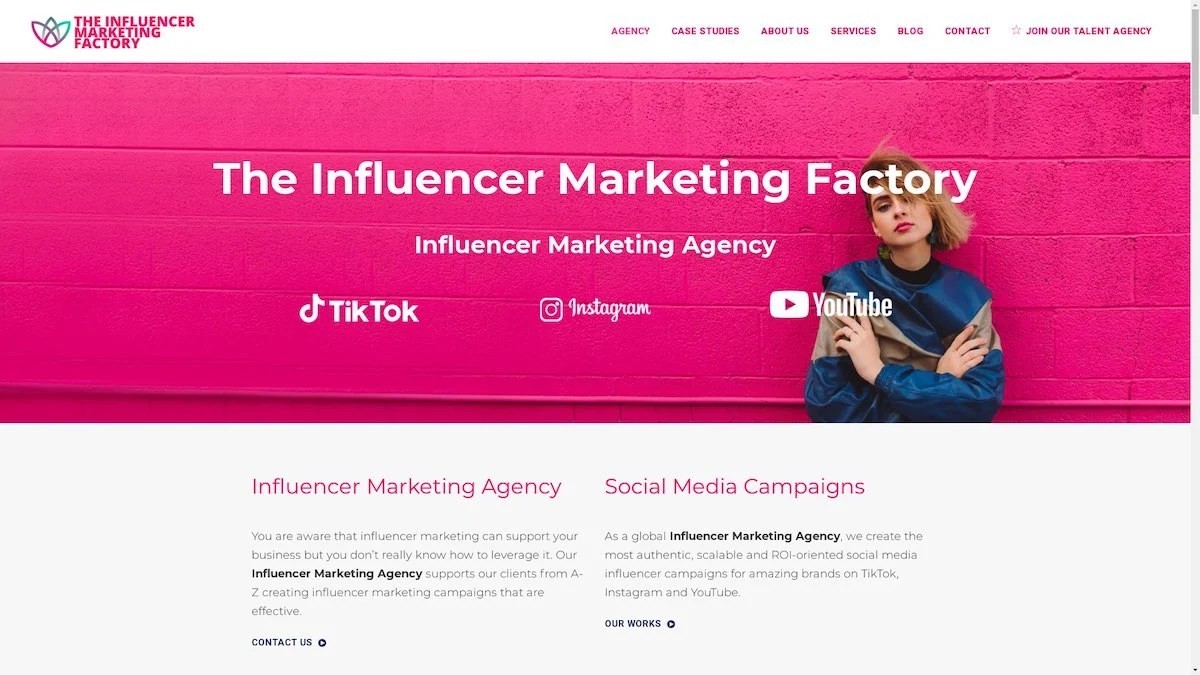
TikTok, Instagram & YouTube CampaignsA full-service agency with strong TikTok expertise, offering end-to-end campaign management from influencer discovery through performance reporting with a focus on platform-native content.Clients: Google, Snapchat, Universal Music, Bumble, YelpVisit TIMF → -
6

NeoReach
Enterprise Analytics & Influencer CampaignsAn enterprise-focused agency combining managed campaigns with a powerful self-service data platform for influencer search, audience analytics, and attribution modeling.Clients: Amazon, Airbnb, Netflix, Honda, The New York TimesVisit NeoReach → -
7

Ubiquitous
Creator-First Marketing PlatformA tech-driven platform combining self-service tools with managed campaign options, emphasizing speed and scalability for brands managing multiple influencer relationships.Clients: Lyft, Disney, Target, American Eagle, NetflixVisit Ubiquitous → -
8

Obviously
Scalable Enterprise Influencer CampaignsA tech-enabled agency built for high-volume campaigns, coordinating hundreds of creators simultaneously with end-to-end logistics, content rights management, and product seeding.Clients: Google, Ulta Beauty, Converse, AmazonVisit Obviously →